
This part of the course is about optimization and simulation: turning data into good decisions with business analytics (BA). This first notebook places that in context: what kind of analytics it is, how it relates to data science, and how a real-life problem becomes a mathematical model.
Learning outcomes
On completion of this notebook, you will be able to:
relate business analytics to data science and big data, and to its roots in statistics, artificial intelligence, and optimization;
place prescriptive analytics among the descriptive/predictive/prescriptive sequence, and explain what distinguishes it;
describe the steps of a BA project, from data collection to implementation, and which field of study each step draws on;
translate a real-life decision problem into the decision/objective/constraints ingredients of a mathematical model.
What Is Business Analytics?
According to Wikipedia, “business analytics refers to the skills, technologies, and practices for continuous iterative exploration and investigation of past business performance to gain insight and drive business planning.” In short, business analytics (BA) is a rational, fact-based approach to decision making. These facts come from data, therefore BA is about the science and the skills to turn data into decisions. The science is mostly statistics, artificial intelligence (data mining and machine learning), and optimization; the skills are computer skills, communication skills, project and change management, etc.
BA by itself is not a science. It is the total set of knowledge required to solve business problems in a rational way. Experience in BA projects and knowledge of the business area the data comes from (such as healthcare, advertising, or finance) is also valuable for a successful business analyst.
BA is often subdivided into three consecutive activities: descriptive analytics, predictive analytics, and prescriptive analytics. During the descriptive phase, data is analyzed and patterns are found. The insights are consequently used in the predictive phase to predict what is likely to happen in the future, if the situation remains the same. Finally, in the prescriptive phase, alternative decisions are determined that change the situation and which will lead to desirable outcomes.
Steps of a BA Project
Analytics can only start when there is data. Certain organizations already have a centralized data warehouse in which relevant current and historical data is stored for the purpose of reporting and analytics. Setting up such a data warehouse and maintaining it is part of the business intelligence (BI) strategy of a company. However, not all companies have such a centralized database, and even when it exists, it rarely contains all the information required for a certain analysis. Therefore, data often needs to be collected, cleansed and combined with other sources. Data collection, cleansing and further pre-processing is usually a very time-consuming task, often taking more time than the actual analysis.
Data collection and pre-processing are therefore always the first steps of a BA project. The data science steps begin after them, with descriptive analytics. A BA project does not end with prescriptive analytics either, that is, with generating an (optimal) decision. The decision still has to be implemented, which requires skills such as change management.
To summarize, we distinguish the following steps in a BA project:
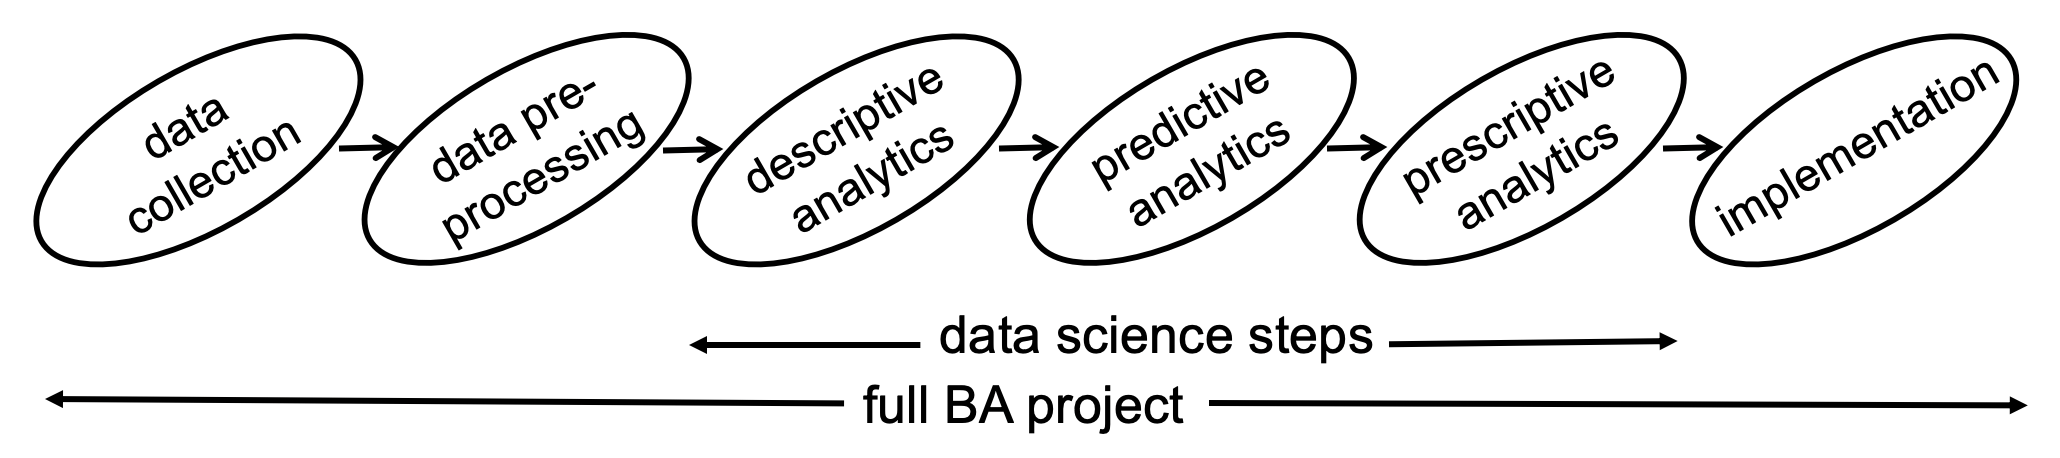
Figure 1:The steps of a BA project.
Figure 1 suggests a linear process, but in practice this is rarely the case. At many of the steps, depending on the outcome, you might revisit earlier steps: if the predictions are not accurate enough for a particular application, for example, you might collect extra data to improve them. Not all BA projects include prescriptive analytics either; many projects have insight or prediction as their goal and finish after the descriptive or predictive steps.
The major scientific fields of study corresponding to these BA steps are:

Figure 2:The scientific fields behind each step of a BA project.
Next to cleansing, feature engineering is an important part of data preparation, to be discussed later. During descriptive analytics you get an understanding of the data: you visualize it and summarize it using the tool of statistical data analysis. A good understanding at this stage is what makes the right choices possible in the steps that follow.
Predictive and Prescriptive Analytics
Following the descriptive analytics step, a BA project continues with predictive analytics. A target value that we want to predict is specified, and the parameters of the selected predictive method are determined based on the data available. We say that the model is trained on the data. The methods originate from inferential statistics and machine learning, which have their respective roots in mathematics and computer science. Although the approach and the background of these fields are quite different, the techniques largely overlap.
Finally, during the prescriptive analytics phase, options are found to maximize a certain objective. Because the future is always unpredictable to a certain extent, optimization techniques often have to account for this randomness. The field that specializes in this is (mathematical) optimization. It overlaps partially with reinforcement learning, which has its roots in computer science. A special feature of reinforcement learning is that prediction and optimization are integrated: it combines the predictive and prescriptive phases in one method.
Data Science and Big Data
Two terms are closely related to BA: data science and big data. Data science is an older term which has recently shifted in meaning and increased in popularity. It is a combination of different scientific fields all concerned with extracting knowledge from data, mainly data mining and statistics. Part of the popularity probably stems from the Harvard Business Review calling a data scientist role “the sexiest job of 21st century”, a label that correctly anticipated the huge demand for data scientists that followed. The knowledge base of data scientists and business analysts largely overlaps. However, the deliverable of BA is improved business performance, whereas data scientists focus more on methods and insights from data. Improved business performance requires optimization to generate decisions and soft skills to implement them. Data science is more often associated with techniques from computer science such as machine learning; BA, in contrast, is more associated with mathematics and industrial engineering.
Big data is a related term. It differentiates itself from regular data sets by the so-called 3 V’s: volume, variety, and velocity. A data set is considered to be “big data” when the amount of data is too much to be stored in a regular database, when it lacks a homogeneous structure (i.e., free text instead of well-described fields), and/or when it is only available real-time. Big data requires adapted storage systems and analysis techniques in order to exploit it.
Big data receives a lot of attention today because of the speed at which it is collected. As more and more devices and sensors that automatically generate data connect to the internet (the internet of things), the amount of stored data doubles approximately every 3 years. However, most BA projects do not involve big data, but use relatively small and structured data sets. Such a data set may have originated as big data, with the relevant information later extracted from it.
From Real-Life Problem to Model
Every optimization problem in this course has the same three ingredients. A real-life problem consists of:
a decision we get to make, which becomes the decision variables;
a system that constrains what decisions are allowed, which becomes the constraints;
an outcome we care about, which becomes the objective function.
The real-life question, “which feasible decision gives the best outcome?”, then becomes a precise mathematical one. The value of this translation is that all kinds of problems, from very different domains, can be expressed in the same “universal modeling language” of mathematics, so that the same general solution methods and software apply to all of them.
The workflow is a loop rather than a straight line:
real-life problem → (modeling) → model → (solving) → decision
with data and data analysis feeding the model’s parameters, and with results often sending you back to refine the model. Most of the effort, and most of this course, is in the modeling step, not the solving step.
“The formulation of a problem is often more essential than its solution, which may be merely a matter of mathematical or experimental skill.” Albert Einstein & Leopold Infeld, The Evolution of Physics (1938)
In Linear Optimization we make this concrete with a four-step modeling approach: study the problem in detail, define the decision variables, define the objective, define the constraints.
Further Reading
The sections above closely follow Section 1.1 of Koole (2019). The rest of Chapter 1 goes into the historical background of BA’s constituent fields, a non-technical overview of techniques and tooling (R, Python, Excel), and the legal and ethical aspects of working with data; none of that is needed for the optimization and simulation material that follows, but it is worth reading once. Practical setup (Python, libraries, solvers) is covered on the home page.
References
Koole, G. (2019). An Introduction to Business Analytics. Chapter 1, “Introduction.”
Wikipedia contributors. “Business analytics.” Wikipedia, The Free Encyclopedia.
Davenport, T.H., & Harris, J.G. (2007). Competing on Analytics: The New Science of Winning. Harvard Business School.
Einstein, A., & Infeld, L. (1938). The Evolution of Physics. Cambridge University Press.
Powell, S.G., Baker, K.R., & Lawson, B. (2009). “Impact of errors in operational spreadsheets.” Decision Support Systems, 46:126–132.